What Is Revenue Analysis: Key Methods for SaaS
Understand what is revenue analysis: key methods, metrics, and pitfalls for SaaS to boost product decisions and revenue growth.
You're probably dealing with a backlog that looks rational on the surface and messy underneath. Sales wants a feature that could unblock a strategic account. Support wants a bug fix because tickets keep piling up. Engineering wants to pay down debt before the next release slows to a crawl. Finance is watching retention, but the product dashboard still tells a different story.
That's where many teams get stuck. They have metrics, but not enough context to decide what matters first.
Revenue analysis is supposed to solve that. In practice, many teams reduce it to a finance report. They watch recurring revenue, check churn after the fact, and review growth trends once the quarter is already gone. That's useful, but it's incomplete. The better version connects revenue to customer behavior while there's still time to act on it.
Why Revenue Analysis Is Your Product Team's Superpower
A new product manager often starts by trying to prioritize based on volume. The loudest customers get attention. The largest account in the current sales cycle gets attention. The issue with the most tickets gets attention. Sometimes that works. Often it sends the team straight into local optimization.
A better question is simpler. What is this problem worth, in revenue terms, if we solve it or ignore it?
That shift changes everything. A bug affecting a narrow workflow may matter more than a popular usability complaint if it blocks renewals in your highest-value segment. A feature request that shows up only a handful of times may deserve immediate investment if it repeatedly surfaces in expansion conversations. A support issue that looks operational may be a product issue with direct commercial consequences.
The difference between noise and signal
In SaaS, product teams make bets with incomplete information every week. Revenue analysis gives those bets economic context. It helps you see which customers, plans, channels, or workflows matter most to the business instead of treating all feedback as equal.
That's why it belongs in product, not just finance.
If you want a broader foundation for how product teams should think about evidence and prioritization, this guide to analytics for product managers is a useful companion. The key idea is the same. Data becomes valuable when it helps you make a better decision, not when it creates a prettier dashboard.
Practical rule: If a PM can't explain how a roadmap item ties back to retention, expansion, pricing power, or revenue protection, the team is probably prioritizing by intuition.
Gut feel still matters. Experienced PMs develop strong instincts. But revenue analysis keeps those instincts honest. It forces the team to ask whether a request is strategically important, commercially meaningful, or just urgent because someone influential mentioned it yesterday.
Defining Revenue Analysis Beyond the Basics
A PM sees revenue dip three points in the monthly review. Finance reports the number correctly, but that number alone does not tell the product team whether the problem started with weaker activation, heavier discounting, failed expansion, or a support issue that pushed good accounts toward downgrade.
That is the difference between basic reporting and revenue analysis.
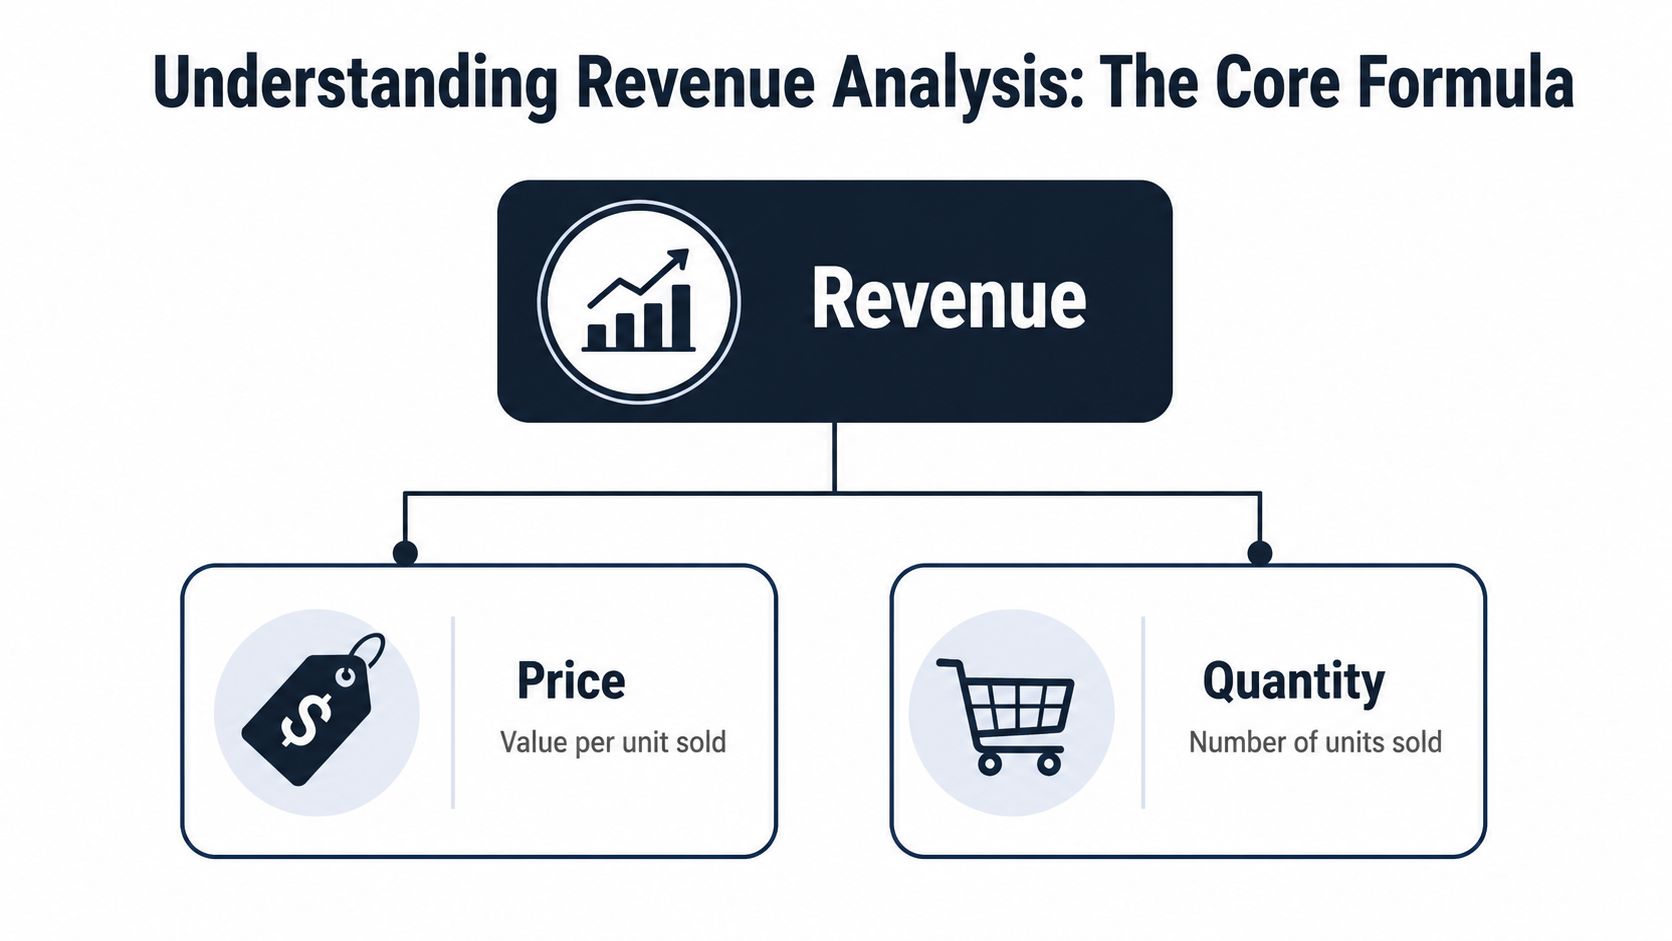
The basic formula still matters. Revenue = Units Sold × Average Selling Price. It gives teams a starting point. In SaaS, though, operating the business on that formula alone creates blind spots because subscription revenue moves through retention, expansion, contraction, pricing, seat adoption, and usage patterns that do not show up in a single top-line figure.
Revenue analysis breaks that top line into drivers a team can act on. It asks which part of the commercial system changed, why it changed, and whether the shift is temporary, structural, or product-driven.
For SaaS teams, I use a simple test. If a metric moves, can the team trace that movement to customer behavior and a product decision? If not, the analysis is still too shallow.
Revenue analysis connects money to behavior
A useful definition is simple. Revenue analysis is the discipline of explaining revenue movement by isolating the factors behind it.
One common framework breaks revenue into drivers such as customer count, revenue per customer, purchase frequency, items per purchase, and price per item, as outlined in Hyperbots' explanation of revenue analysis. The exact model matters less than the habit. Teams need a repeatable way to separate acquisition problems from retention problems, pricing changes from packaging changes, and demand shifts from product friction.
In SaaS, that means looking beyond booked revenue and asking questions like these:
- Did new accounts convert, but fail to activate into repeat usage?
- Did expansion slow because customers hit a product limit or never discovered premium workflows?
- Did average contract value rise while net retention weakened because discounting hid churn risk?
- Did support volume spike in a specific segment before downgrades showed up?
That last point is where modern product teams get an advantage. Traditional revenue analysis focuses on lagging indicators such as MRR, ARR, churn, and ARPU. Those are still required. The stronger approach connects those financial outcomes to behavioral signals such as feature adoption, onboarding completion, support tickets, seat utilization, and account health changes. That gives teams a shot at preventing revenue loss before finance closes the month.
Segmentation turns totals into decisions
Total revenue is useful for the board deck. It is weak guidance for a PM.
Real insight starts when revenue is segmented by customer type, plan, acquisition channel, geography, cohort, and product behavior. A flat renewal rate can hide very different realities underneath. Enterprise accounts may be expanding while mid-market accounts are shrinking. Self-serve customers may look healthy overall, while users who never adopted a key workflow are churning at a much higher rate.
This is also why clean definitions matter. A KPI review falls apart fast when finance, product, and customer success use different logic for active customers, expansion, or churn. A practical KPI report template for cross-functional revenue reviews helps teams align on the same measurements before they start arguing about causes.
A close cousin to this work is accounting accuracy. If you need a practical refresher on the finance side, this overview of mastering revenue recognition helps clarify when revenue should be recognized versus when product teams merely assume value has been created.
| Revenue view | What it tells you | What it misses |
|---|---|---|
| Total revenue | Overall direction | Source of growth or decline |
| Revenue by segment | Strong and weak parts of the business | Why one segment behaves differently |
| Revenue by cohort | How customer groups change over time | Which product or support events shaped the outcome |
| Revenue plus behavior | Which actions signal risk or expansion early | Requires connected financial and product data |
Revenue analysis becomes valuable when it helps a PM decide what to fix, what to invest in, and which customer behavior deserves immediate attention.
Key Methods and Core Revenue KPIs
The first mistake teams make is treating all revenue metrics as equally actionable. They aren't. Some tell you what happened. Others help you understand why. A few are useful only when paired with product and customer data.
A practical operating model usually combines methods with KPIs. The method gives you the lens. The KPI gives you the measurement.
The methods that answer different questions
Trend analysis is the simplest. You track revenue metrics over time and ask whether the movement is consistent, seasonal, or unusual. This is how teams spot slow erosion before it becomes a quarter-end surprise.
Variance analysis compares actual performance with forecast, plan, or target. It's useful when leadership expected one outcome and got another. The core value isn't the gap itself. It's the decomposition of the gap.
Cohort analysis is where product managers should spend more time. Instead of averaging everyone together, you follow groups of customers that started at the same time, entered through the same channel, or adopted the same feature set. That helps you see whether certain onboarding paths, plan tiers, or product behaviors lead to stronger retention and expansion.
For teams building KPI reporting discipline, this KPI report template guide is a solid reference because it pushes metrics into a decision-making format instead of a dashboard-for-dashboard's-sake format.
The KPIs worth caring about
A few revenue KPIs consistently matter in SaaS:
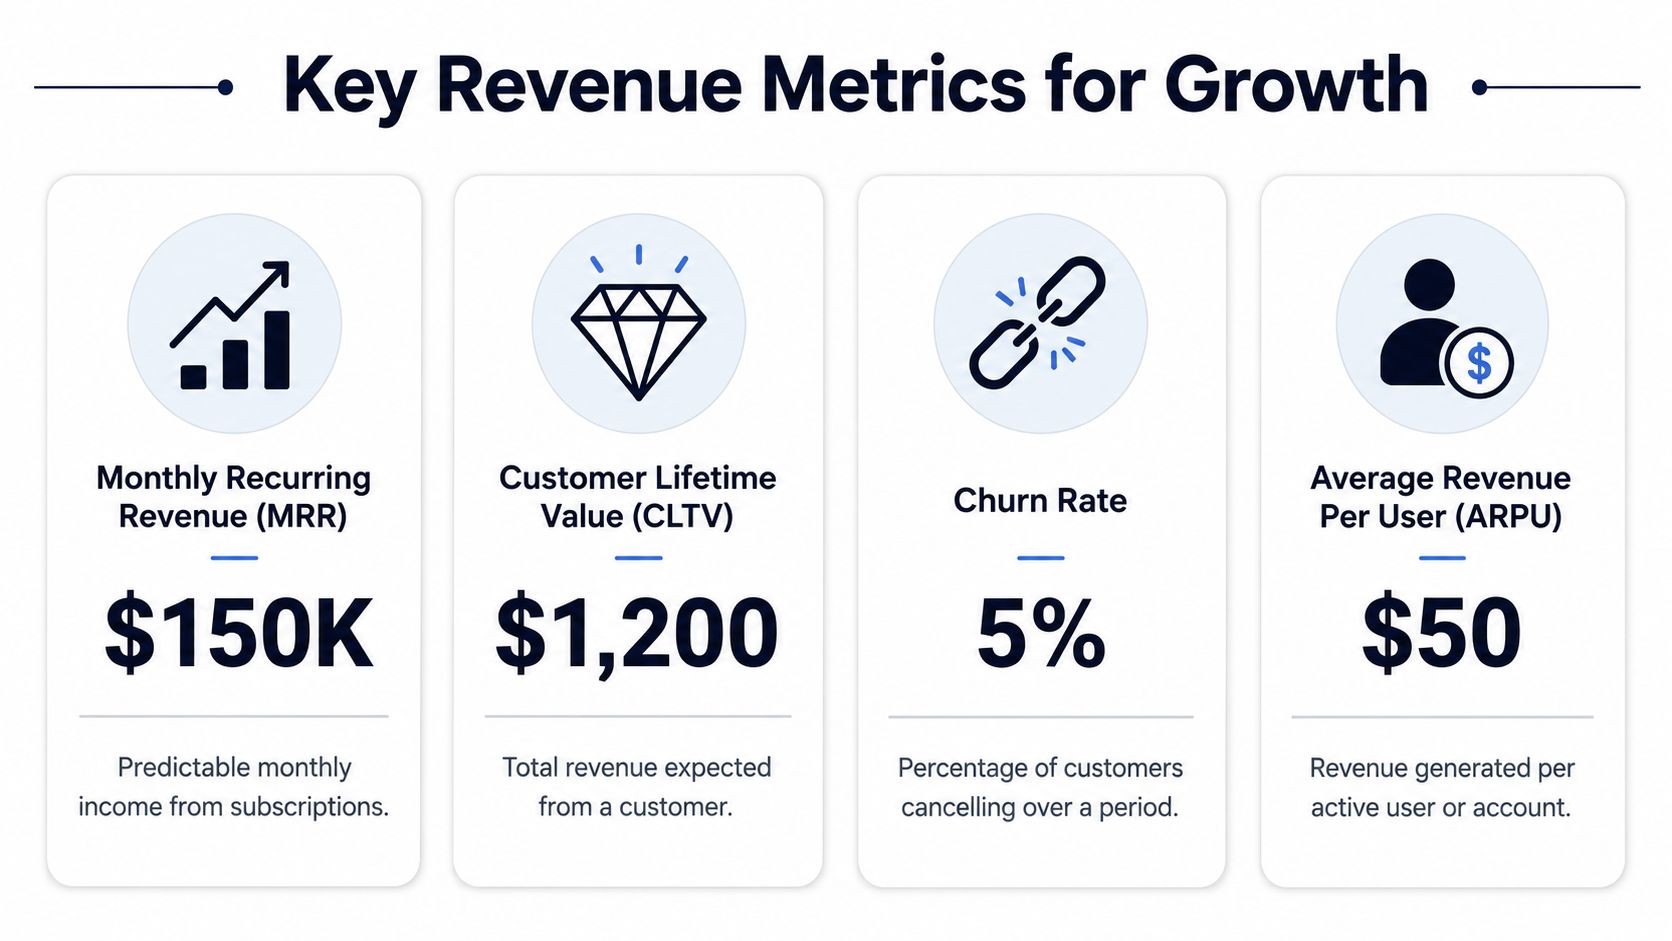
- MRR and ARR: These help you track predictable recurring income and understand the shape of the business. If you need a plain-English refresher, this guide to exploring MRR and ARR covers the basics well.
- ARPU: Average Revenue Per User shows the value generated per active user or account. It helps expose whether growth is coming from customer count or better monetization.
- CLTV: Customer Lifetime Value estimates the total revenue expected from a customer relationship. It's a strategic metric for acquisition efficiency, account prioritization, and retention investment.
- YoY growth: This tells you whether the business is growing in a durable way or just oscillating month to month.
- Net revenue retention: Especially useful for understanding whether existing customers are expanding fast enough to offset contraction and churn.
Here's a useful benchmark from the SaaS side. Effective revenue analysis has been shown to correlate with 87% accuracy in predicting churn risk and expansion opportunities, especially when teams systematically track metrics such as YoY growth, ARPU, and CLTV, according to HubiFi's revenue financial analysis guide.
That number matters less as bragging rights and more as a planning signal. It tells you the discipline can move beyond rear-view reporting and into prediction.
To ground the metrics in practice, this short video gives a helpful overview:
What each KPI should trigger
| KPI | Good for | Weak if used alone |
|---|---|---|
| MRR or ARR | Forecasting recurring revenue | Doesn't explain customer behavior |
| ARPU | Pricing and packaging insight | Can hide segment-level problems |
| CLTV | Investment and retention decisions | Depends on underlying assumptions |
| YoY growth | Strategic health check | Too broad for roadmap choices |
| NRR | Expansion and retention quality | Doesn't reveal feature-level causes |
If a KPI doesn't change what the team does next, it belongs lower on the dashboard.
Performing Revenue Analysis in a SaaS Business
A month before renewal, an account still looks healthy in the revenue report. ARR is intact. No downgrade has hit the ledger. Then support volume climbs, usage of a core workflow drops, and the admin stops inviting new seats. By the time finance records the loss, the product team has already missed several chances to prevent it.
That is the practical job of revenue analysis in SaaS. Connect billing outcomes to customer behavior early enough to change the result.
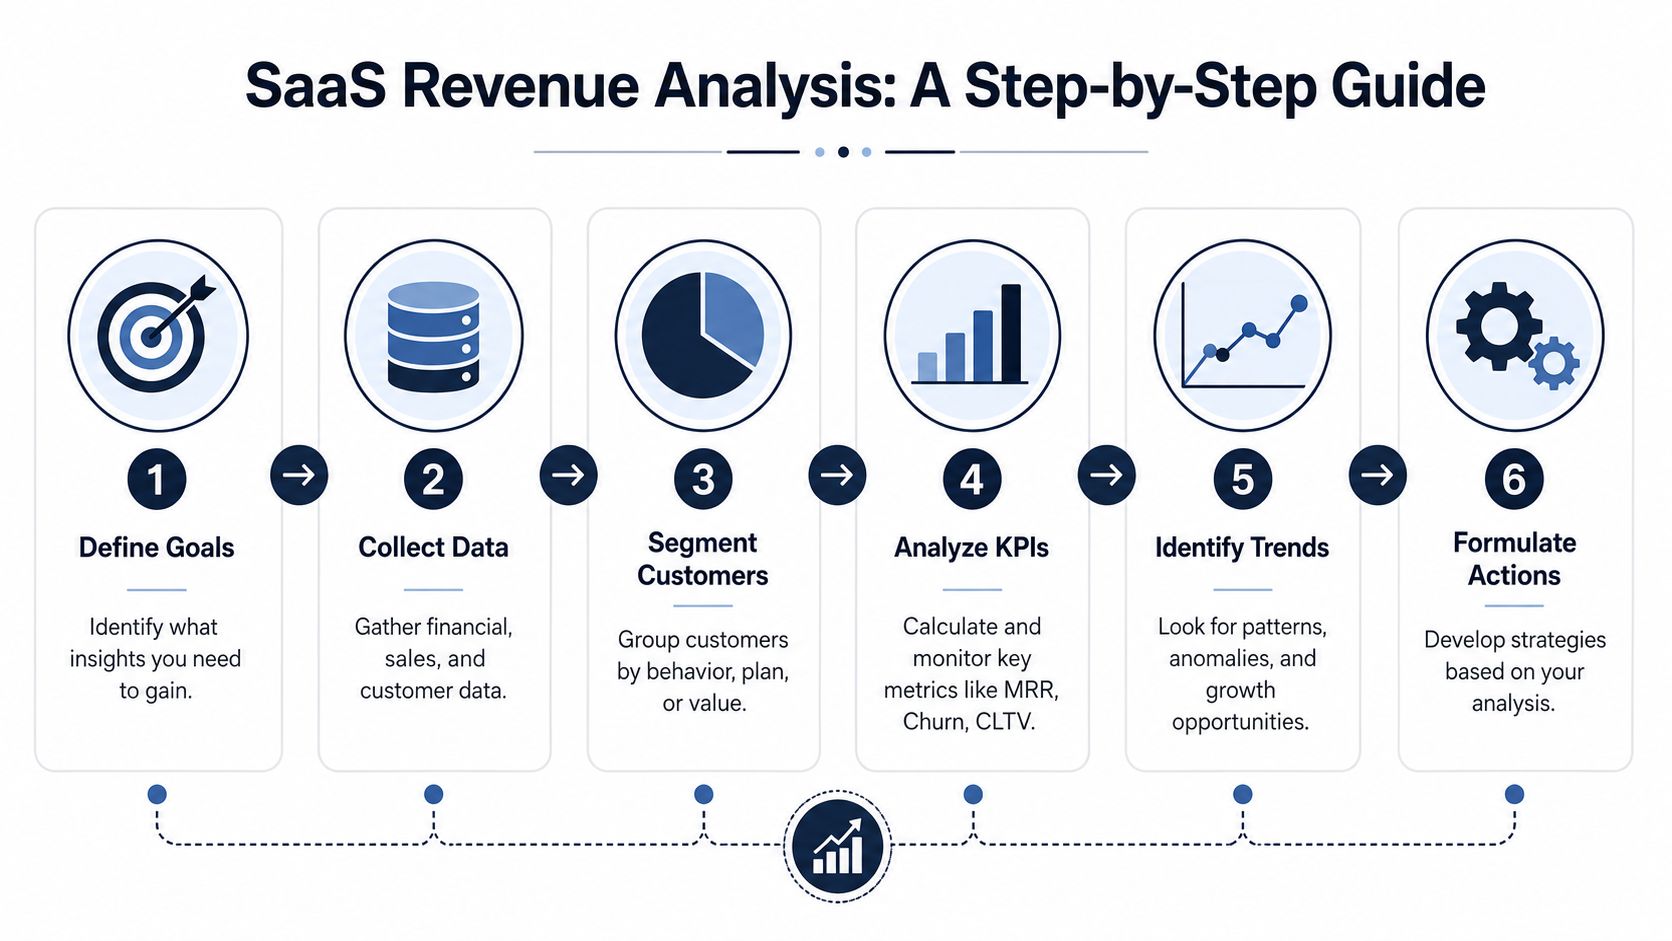
Start with a business question
Start with a question that would change a roadmap, renewal playbook, or pricing decision.
Examples:
- Retention question: Which customer behaviors appear before downgrades or cancellations?
- Expansion question: Which features show up consistently in larger renewals or add-on purchases?
- Pricing question: Where are discounts covering up weak product fit?
- Support question: Which recurring issues are concentrated in high-value accounts?
A vague question produces a polished report and little else. A sharp question gives teams something they can act on.
Build the data layer carefully
Useful analysis depends on joining systems that were not designed to work cleanly together. Finance has billing records. Sales has CRM history. Support has ticket themes and resolution times. Product has event data. The hard part is not collecting more data. It is matching accounts, users, and time periods accurately enough that the conclusions hold up under scrutiny.
A typical SaaS stack includes Salesforce or HubSpot, Stripe or Chargebee, NetSuite, Zendesk or Intercom, Amplitude or Mixpanel, Jira, and a warehouse such as Snowflake or BigQuery. The tool list matters less than identifier quality. If account IDs, contract dates, plan names, and workspace mappings are inconsistent, the analysis breaks fast.
Teams also need to separate attribution from revenue analysis. Attribution asks which touchpoint gets credit for a conversion. Revenue analysis asks why revenue changed, which usually involves product usage, pricing, support load, and customer maturity together. This explanation of what revenue attribution means is a useful reference if the terms are getting mixed up internally.
Segment before you summarize
Average metrics hide the operating truth. Enterprise accounts behave differently from self-serve accounts. New customers have different risks than mature ones. A high-support segment may still be attractive if expansion rates justify the cost to serve.
Strong analysis usually segments by:
- Acquisition channel
- Plan tier or contract type
- Geography
- Lifecycle stage
- Product adoption pattern
- Support intensity
In practice, this is often where teams find that a small group of accounts, workflows, or features drives a disproportionate share of revenue. They also find the opposite. Some loudly requested features create activity but little commercial value, while a neglected bug in one workflow can put large renewals at risk.
Connect money to behavior
This is the part that separates finance reporting from product intelligence.
Look for behavioral signals that show up before the revenue event:
- Support patternsRepeated tickets on one workflow, long resolution cycles, or frustration around a specific integration.
- Usage changesDrop-offs in core actions, reduced seat activation, or stalled onboarding milestones.
- Commercial signalsDiscount requests, delayed renewals, lower expansion interest, or repeated objections in sales calls.
- Product quality eventsBugs, performance issues, or broken handoffs between modules.
The goal is not to prove a perfect causal chain every time. The goal is to find patterns strong enough to guide action. In SaaS, teams rarely get clean lab conditions. They get directional evidence, imperfect systems, and limited time. That is still enough to prioritize well.
Useful revenue analysis shows which behaviors and product conditions changed before the revenue changed.
Turn findings into a ranking
The output should help product, success, and finance decide what to do next. That usually means a ranked list of risks and opportunities tied to likely revenue impact, confidence level, affected accounts, and recommended action.
A spreadsheet of segmented revenue is a starting point. A ranked view is what helps a team choose between fixing onboarding friction, addressing a support-heavy integration, changing packaging for one segment, or asking customer success to intervene before renewal risk becomes visible in the P&L.
Practical Applications and Real-World Examples
The easiest way to understand revenue analysis is to watch how it changes a real product conversation. Not a polished board slide. A Tuesday afternoon prioritization meeting where every team has a different opinion.
Example one, finding churn before finance closes the month
A SaaS company notices retention pressure in one customer segment. Finance can see the revenue effect. Customer success can feel the tension in renewal calls. Product still doesn't know where to look.
The first pass at analysis shows the weakness is concentrated in accounts on a specific plan tier that adopted one workflow heavily during onboarding. That narrows the field. The product team then joins support data and usage logs. A pattern appears. Customers who encountered repeated friction in that workflow opened more support tickets, used adjacent features less often afterward, and became more likely to disengage ahead of renewal.
Nothing about this requires a dramatic dashboard. It requires correlation and discipline.
The roadmap result is concrete. Instead of launching a broad retention initiative, the team fixes the failing workflow, rewrites the onboarding path around it, and gives customer success a targeted list of accounts to contact before renewal conversations go sideways.
The strongest churn analysis usually starts with one uncomfortable question: which customer behaviors changed before the revenue changed?
Example two, spotting an expansion opportunity hidden in product usage
A different team is trying to decide whether to invest in a new integration set or continue polishing a general collaboration feature. Both have vocal internal supporters. Neither side is wrong. The problem is that opinion alone can't rank the bet.
Revenue analysis helps by focusing on the highest-value customer group rather than all active users. The team examines accounts with stronger expansion patterns and compares them with similar accounts that stayed flat. One behavior stands out. The expanding accounts rely heavily on a specific integration and use it as part of a broader operational workflow. That behavior also appears repeatedly in sales conversations tied to larger opportunities.
The product implication is sharper than “customers want integrations.” It becomes “this integration anchors a workflow associated with higher-value accounts and expansion readiness.” That's a very different level of confidence.
What works and what doesn't
A few habits separate useful application from wasted motion:
- What works: Starting with a business problem and tracing backward into data.
- What works: Comparing similar customer groups instead of averaging everything together.
- What works: Reading support, sales, and success signals alongside product analytics.
And the patterns that usually fail:
- What doesn't: Treating churn as a finance metric instead of a product signal.
- What doesn't: Prioritizing feature requests by request count alone.
- What doesn't: Assuming the most-used feature is the one driving expansion.
A seasoned PM eventually learns that revenue analysis is less about reporting the past than about assigning confidence to the next decision.
Common Pitfalls in Revenue Analysis
The most common failure is treating revenue analysis like a scorecard instead of an operating system. Teams stare at top-line growth and miss the underlying mechanics. Finance sees the outcome. Product never sees the cause.
Where teams go wrong
One mistake is overvaluing aggregate metrics. A healthy headline number can hide a weak cohort, a risky dependency on one channel, or too much discounting in the wrong segment.
Another is mistaking activity for value. More tickets, more feature requests, and more user events don't automatically mean more revenue impact. Product teams need weighting, not just counting.
A third is organizational. Finance, support, product, and sales often work from different versions of reality. When the systems aren't connected, every function creates its own explanation for the same revenue trend.
The biggest blind spot
The biggest blind spot is behavioral. Many teams still wait for the P&L to confirm a problem they could have seen earlier in support conversations, usage drop-offs, or feature-level friction.
That gap is becoming harder to justify. 65% of SaaS leaders now prioritize behavioral revenue drivers over historical financials, while 90% of public content still lacks that predictive dimension, according to Orb's analysis of revenue analysis content and behavioral signals.
Historical financials tell you where revenue went. Behavioral data often tells you where it's about to go.
If your analysis can't connect money to customer actions, it's probably too late to be useful for product prioritization.
From Analysis to Action Tools and Outputs
The tool stack matters less than the output. Teams usually need three categories.
Traditional BI tools like Tableau, Power BI, or Looker help with reporting and segmentation. Product analytics tools like Amplitude or Mixpanel help teams understand usage patterns and adoption paths. Then there's a newer category focused on product intelligence, where behavior, support data, and commercial context are analyzed together. One option in that category is SigOS, which connects support tickets, chat transcripts, sales calls, and usage metrics to identify patterns tied to churn, expansion, and revenue impact.
The outputs that actually help product teams
A modern revenue analysis output should be operational, not archival.
That usually means:
- Dynamic dashboards that combine financial and behavioral signals by account, segment, or feature area.
- Revenue-weighted issue queues inside Jira or Linear so engineering sees commercial importance, not just ticket count.
- Alerts for emerging risk when support and usage patterns begin to resemble past churn cases.
- Opportunity views that highlight requests, integrations, or workflows associated with expansion conversations.
A static monthly report still has value. But the most useful version of revenue analysis shows up where decisions happen. In backlog grooming, renewal prep, pricing reviews, and roadmap planning.
If you're a PM trying to answer what is revenue analysis in practical terms, the answer is simple. It's the discipline of connecting business outcomes to customer behavior early enough to change what your team does next.
If you want to move beyond lagging revenue reports and see which product issues, support patterns, and customer behaviors are tied to churn risk or expansion potential, take a look at SigOS. It's built for teams that need revenue analysis to drive prioritization, not just reporting.


Ready to find your hidden revenue leaks?
Start analyzing your customer feedback and discover insights that drive revenue.
Start Free Trial →